When I think of recessions, I tend to think that the only bad years are the ones within the recession dates. For example, if the NBER dates a recession as January 1 to December 31, I tend to think the only bad dates occur within those dates, and that the time before and after those dates are great times economically.
I decided to take that perception and put it to the test. Below are charts for the last five recessions, along with the preceding three to four quarters and the first three to four quarters after the recession ended. The dates for the recessions are from the National Bureau of Economic Research and the charts are from the St. Louis Federal Reserve. All the GDP data has been adjusted for inflation.
January 1980 – July 1980 and July 1981 – November 1982
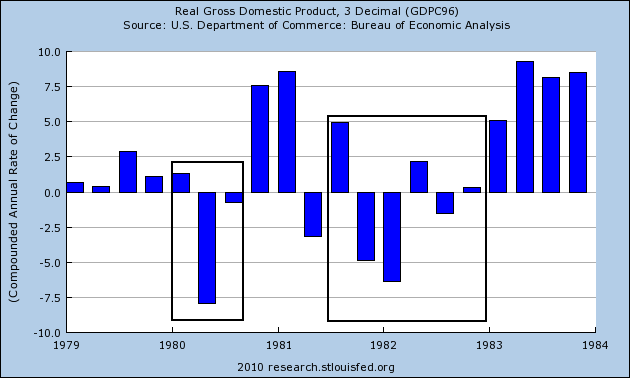
I’ve included both of these periods in the same chart for convenience. First, notice the period of four quarters leading up to the first recession showed incredibly slow growth. The quarter to quarter rate of growth for this period (1Q79 to 4Q 79) was .7%, .4%, 2.9% 1.1%. respectively. This was followed by three quarters of recession, during which the first quarter showed positive growth. Then came the brief recovery where we saw two quarters of incredibly strong growth and a third quarter of contraction. This was followed by the second recession during which we had two quarters to non-sequential positive GDP growth. Coming out of the recession we had incredibly strong rates of growth beginning in the second quarter after the end of the second recession.
There are several points that need to be made about this period. First, there were four years of incredibly difficult times, during which we had two recession (or perhaps one long recession). Either way, this was an extended period of difficulty for the country. Secondly, the four quarters before the recession showed incredibly slow economic growth. Growth at this pace probably felt like a recession to the country. Third, there were quarters of growth during the recession, indicating not all the events during these periods were bad.
July 1990 – March 1991
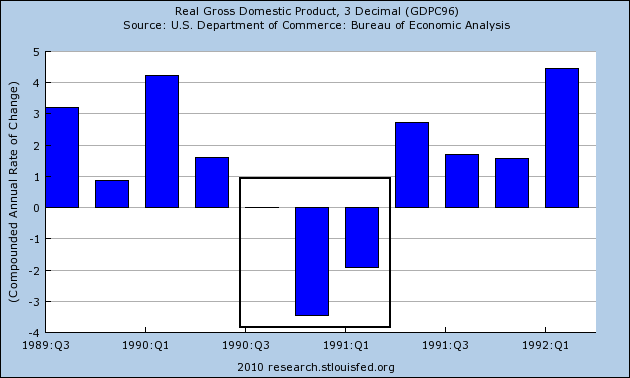
Notice that in the four quarters that led up to the recession there were two quarters of weak growth with one below 1% and the second below 2%. The quarter that began the recession printed a 0% growth rate followed by two quarters of negative growth. However, the three quarters coming out of the recession had incredibly weak growth, with two quarters below 2%. Over a period of nine quarters, there were 8 (or two years) of incredibly weak growth.
March 2001-November 2001
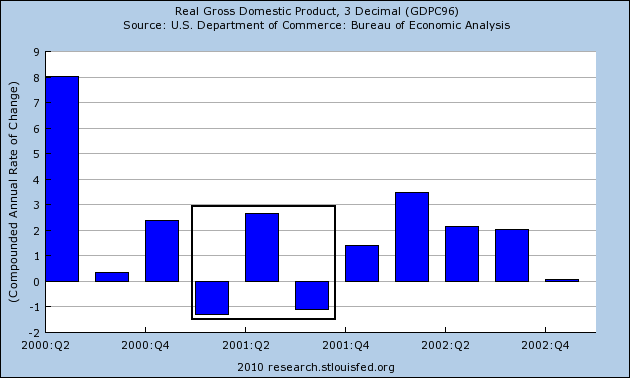
As the chart shows, this was a very shallow and short recession, lasting less than a year during which there were two quarters of negative growth. The contraction was very mild, with the first quarter of 2001 contracting 1.3% and the third quarter contracting 1.1%. But notice the two preceding quarters were also very weak and the five quarters after the recession ended were also very weak. The above chart shows 10 quarters or two and a half years of very weak growth. In other words, the official recession dates cover some of the downturn, but certainly not all of it.
December 2007 – July 2009
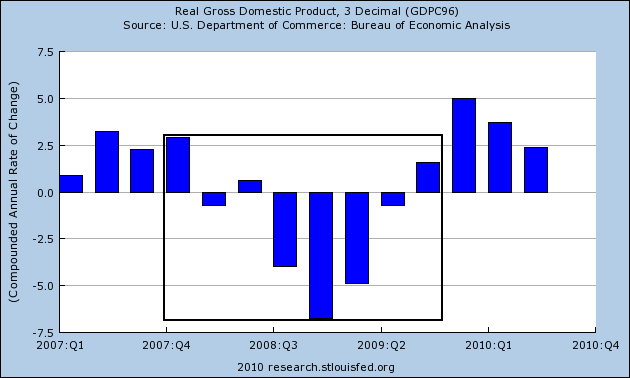
First, the NBER has not officially dated the end of the last recession. However, the St. Louis Fred’s system uses July 2009 as the end point, which would be the first quarter of positive growth after four quarters of contraction. This falls in line with general previous NBER methodology. In addition, the economy has had four quarters of positive GDP growth — a statistic that has never been classified as a recession.
Second, notice that the three quarters preceding the recession also showed slower growth. The contraction was at least as deep as the second recession in the early 1980s. Coming out of the recession, we see three quarters of growth, although the pace is quarter to quarter improvement is declining.
Conclusions:
1.) The double dip recession in the early 1980s was the last recession where the economy experienced strong post-recession momentum. The quarters after the 1990 and 2001 recession were weak and the current rate of growth — while higher than the 1990s and 2001 rate of growth — is not as strong as we’d like to see.
2.) The 1990/91, 2001 and current recessions saw 10 quarters of weak growth, indicating the official dates of the recession only tell part of the economy story.
3.) The current environment has more in common with the early 1980s and 1990s recessions. Like the early 1980s, the latest recession saw an extremely negative growth rate in the economy. Like the early 1990s recession, this recession was in part caused by negative development in the financial sector of the economy.