As we transition from a more generalist mode to focus more specifically on this November’s midterms, I’ve got a lot of of R&D to do. I’m generating a new set of pollster ratings, for instance, and building rigorous forecasting models for both the House and for gubernatorial elections, neither of which we had in place in 2008. These are time-consuming projects, and sometimes might eat into my ability to do day-to-day blogging. But trust me on this one — your patience will be rewarded, and we’ll have some very cool new initiatives to unveil soon.
One nice thing about doing this research, moreover, is that I’m periodically able to discover things that have more immediate relevance. For instance, we have a couple of important Southern coming primaries coming up: Alabama votes tomorrow, and there are key primaries in Arkansas and South Carolina the following week. How much faith should we put in the polls of these races?
The answer is not very much, especially in the case of Democrats. The chart below lists the average error in polls conducted of party primaries from 2000 to the present day, with the results broken down by party and region.**
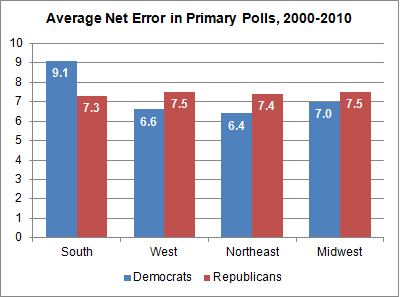
Primary polling is fairly poor. Whereas the average error in general election polls is on the order of 3-4 points for Presidential races, and 4-5 points for Senate and gubernatorial races, it’s more like 7 points when forecasting the margin between the top two primary candidates. Between late-deciding voters, uncertainties accounting to turnout, and sometimes unusual demographics, the pollsters have a lot of challenges on their hands.
But the polls have been especially bad in one particular type of primary: that involving Southern Democrats. There, the average error has been slightly over 9 points.
Much of this is driven by 2008, when the polls tended to lowball Barack Obama’s performance in Southern states. In those primaries, the polls missed by an average of 9.4 points. Outside of those Clinton-Obama contests, the sample size is fairly small: about 35 polls covering roughly 10 Democratic contests. Still, the error on those non-2008 races is above-average: 7.6 points, higher than what its been for Democrats in other regions.
The bottom line is that if you’re used to taking polls with a grain of salt, primary polls require more like a tablespoon’s worth. And polls of Southern Democratic primaries might need a whole salt shaker.
** The database is dominated by Presidential primaries, as I’ve only started tracking polls for Senate and gubernatorial primaries beginning this year. In general, all polls with a median field date within 21 days of the primary are included, although a handful of exceptions are made in the event of major developments which radically alter the state of the campaign (for instance, no polls of New Hampshire are included until the Iowa caucuses occur, and no polls of states other than New Hampshire are included until New Hampshire votes.)