Is there something suspicious about the results in the US Senate primary victory of unknown Democrat Alvin Greene, who defeated fellow Democrat Vic Rawl, 59 percent to 41 percent? I’m not sure yet, but there is a whiff of something strange going on here.
As many of you probably know already, Greene is a candidate who seems to have mysteriously come out of nowhere to win–and rather comfortably at that–despite having not even so much as a campaign website. Of course, according to a Public Policy Polling survey conducted the final week of May, 82 percent of the state also had never heard of Rawl, and among the remaining 18 percent who knew of him Rawl’s favorability was just 5 percent.
Before proceeding to explain the graphic below, I want to first share an email I received from Rawl campaign manager Walter Ludwig, and also fully disclose that Ludwig happens to be a close friend. But I would never write about a race that a friend has such a close, vested interest in–unless I had a significant reason to believe something might be amiss. And although there may be other, perfectly reasonable explanations (see below), I do think there is at least a possibility that something unusual happened Tuesday in South Carolina.
I asked Ludwig to just spell out in an email what irregularities the Rawl campaign sees as evidence that something is amiss. Following is the text of the email Ludwig sent me, verbatim, except for a few words he abbreviated that I spelled out, or the addition of first names he left out that I have inserted:
First, you need to understand that we don’t know what went on or whether the things we’re seeing in the numbers are significant. They seem like they are, but we’re not world-renowned electoral statisticians. We’d like to know, first, if there’s anything here, or if they’re within an acceptable range of “normal.”
Before specifics, some general notes:
*First of all, understand that Alvin Greene did NO campaigning, none. He showed up on filing day with a personal check for the hefty fee ($10,400), was told he had to file with a committee check, ran out and came back with a counter check with “Alvin Greene for US Senate” handwritten on the top. Then he utterly disappeared. No website, didn’t show up at any events (including a big one in his hometown), no signs, no nothing. I was tracking him, just in case, because of general paranoia, but never had any reports of activity.
*We, on the other hand, while we didn’t want to spend a lot of money on primary, we did do 220,000 robocalls (including one with Rep. John Spratt), and sent out about 250,000 emails in the five days before election. So, yes, we weren’t well known, but we had gone to 80 events around the state, and Rawl had some public profile previously, especially in Charleston County.
What’s Weird About Election Night:
*So, like I said, the consensus among a dozen or so people I talked to over the weekend, including the state Dem ED and other knowledgeable observers, was that turnout was going to be between 110,000 and 130,000. Turned out to be close to 190,000.
*It’s hard to attribute to strictly racial preference voting: 65,000 people voted for either Jim Rex or Vincent Shaheen, the two white gubernatorial candidates, and also voted for Greene. Only 33,000 people voted for Robert Ford, the black gubernatorial candidate. There was one other contested race between a white candidate and a black candidate: Superintendent of Education. Both campaigned, and Tommy Thompson, the black candidate, was very well-qualified (though originally from out-of-state). The white guy, Frank Holleman, won by 14 points, and Greene ran ahead of Thompson by 40%.
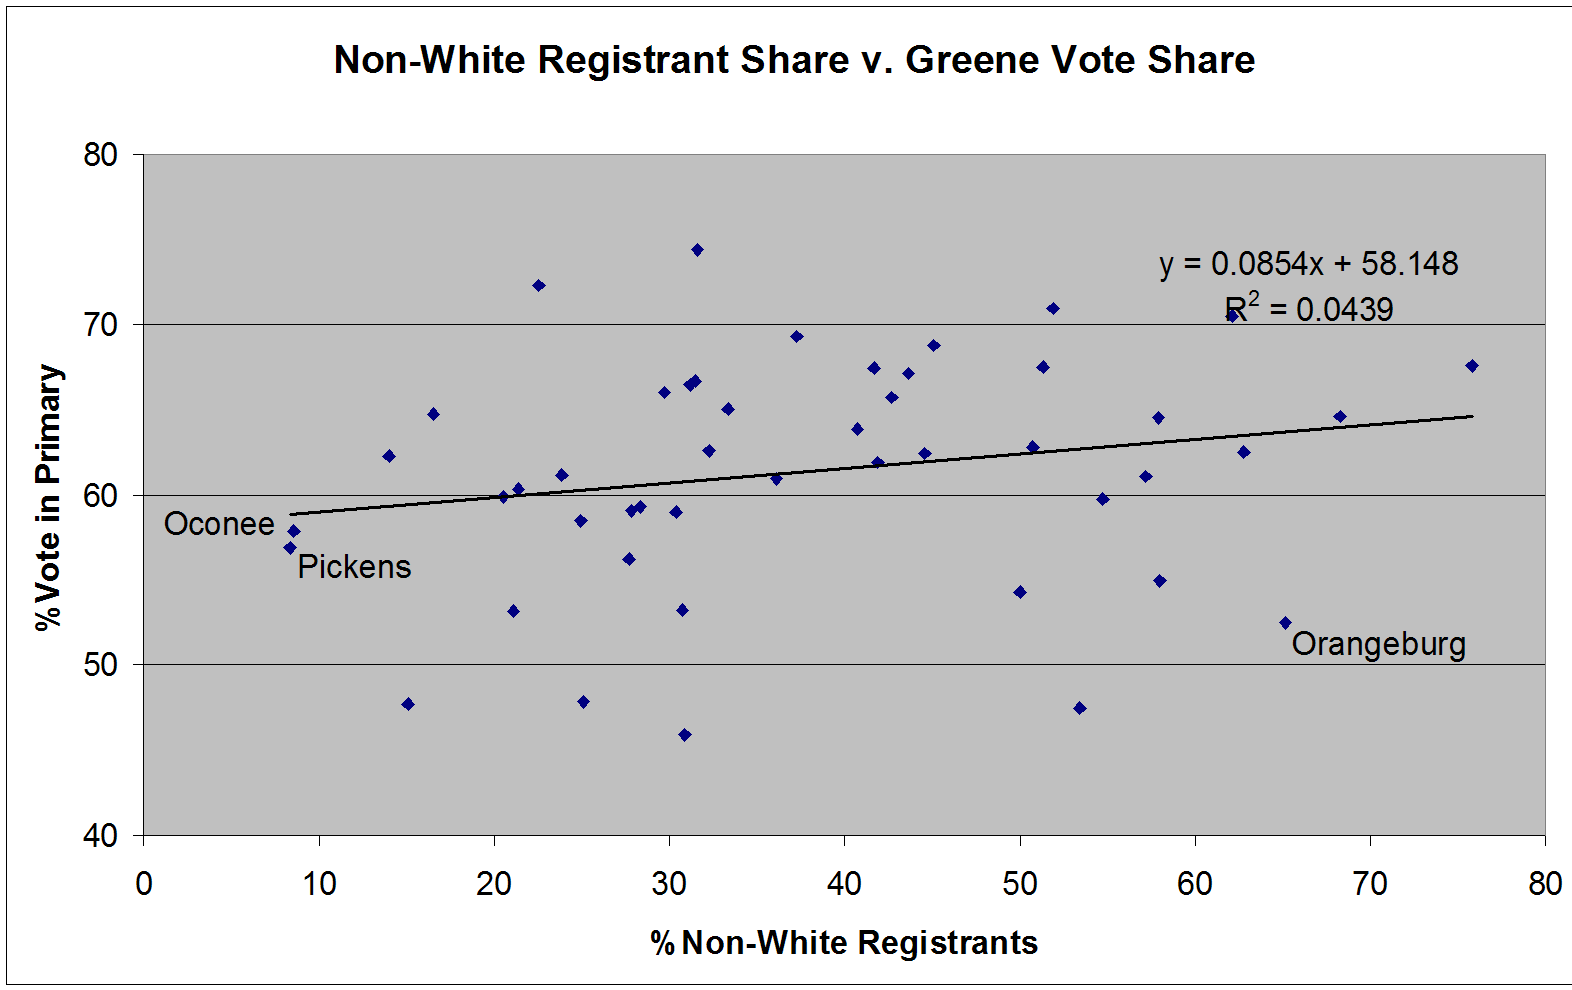
I don’t have anything to say, at least not yet, about the anticipated v. actual turnout on Tuesday. But what I went ahead and did on my own was a quick, county-level analysis of the Greene-Rawl vote, comparing Greene’s share of the two-candidate vote (i.e., Greene/Greene+Rawl) in each county with the non-white share of registrants countywide. (Both sets of data were taken from SC’s State Election Committee.) I then plotted these two percentages against each other in the figure above.
What’s stunning is that there simply is no relationship between the race of a county’s registrants and Greene’s performance in that county.# To be clear, there is a significant enough range in the non-white registrant share–from a low of 8.3 percent in Pickens County to a high of 75.8 percent in Allendale County–as well as in Greene’s county-wide performance, from a low of 45.7 percent in Charleston County to a high 74.4 percent in Greenwood County. And yet the slope is as almost as close to zero as you can get, and the low R-squared affirms that there’s no explanatory value for one variable on the other. (And what slope does appear is largely an artifact of how I cropped the chart by limiting the shown range on the y-axis between 40 percent and 80 percent; had I not done so, which would have made the plotted points and labels too small for readers to see, the zero slope would been even more visually obvious.)
More telling are specific results in a few extreme cases. As I was entering the data, I couldn’t help but notice that the results in three alphabetically consecutive counties–Oconee, Orangeburg and Pickens–were odd, if not counter-intuitive. At 65.1 percent, Orangeburg–site of the infamous and tragic Orangeburg massacre of 1968–features the third-highest non-white registered population of any South Carolina county (behind only Allendale and Williamsburg). Greene won 52.5 percent of all votes cast in Orangeburg for either himself or Rawl. And at first blush, that might seem like nothing unusual–until you realize that Greene did even better in Pickens (8.3 percent non-white registrants) and Oconee (8.6 percent), the two whitest counties in the state. This seems very, very anomalous if race had any bearing at all on this contest. And lest anyone think that Democratic primaries are race-blind, I would remind them of the racialized patterns we witnessed during the 2008 Democratic presidential primary between Hillary Clinton and Barack Obama–and not just in the Palmetto State.
It seems to me one of four things could have happened here:
1. Vic Rawl and his campaign ignored the non-candidacy candidacy of Alvin Greene and so, despite Rawl’s slightly higher but still low statewide name recognition–much of which was unfavorable, mind you–Democratic primary voters chose Greene as a placemarker substitute for a candidate, Rawl, they either didn’t know or, if they did know, didn’t like.
2. Somewhat overlapping with #1, especially for the people who knew nothing about either Greene or Rawl, there was such a low level of voter information that this race was essentially a throw-a-dart-at-the-dartboard race in which one candidate among two mostly unknown candidates, Greene, won for some set of unknown and perhaps inexplicable reasons. (Familiarity of his surname? His name’s location on the ballot alphabetically?)
3. There was a coordinated, shrewd, under-the-radar whisper campaign among Republicans, who knew GOP incumbent Sen. Jim DeMint’s re-nomination was a lock, to vote for Greene in the Democratic primary. If you believe them, the suggestions and rumors that somebody put Greene up to run in the first place–which none other than SC Rep. Jim Clyburn has suggested aloud–gibe with this partisan “strategery” interpretation.
4. There was systematic vote fraud or ballot manipulation by who knows who.
Ludwig informed me by phone today that the Rawl campaign now has two separate teams of experts doing a forensic voting analyses on a variety of data, including absentee ballots. They seem particularly intent on unusual turnout rates and Greene’s performance levels in certain precincts of certain counties. As I learn more, I will let you know.
UPDATE: Some commenters below, including a few who voted in SC, suggest that this was simply a contest in which few people had any idea or information about the two candidates, or even that there were two candidates. In other words, Occam’s razor prevails and it’s simply explanation #2 above, and that we could confirm that by the share of voters who chose not to vote for either candidate–who abstained. In fact, the Democratic primary for Senate had the highest non-participation (or “roll-off”) rate of any of the three statewide contests, including the governor and superintendent of education contests: Of the 197,380 total Democratic voters who showed up, there were 189,348 votes cast in the governor’s primary (4.1 percent abstention rate); 173,829 for SupEd (11.9%), and 170,215 for US Senate (13.8%). (Total turnout here: see page 9.) But it should also be noted that the share of voters who skipped the Senate race was not much higher than the SupEd race, which may only serve to prove many Democrats had little to no information about either of the candidates in both of the races. However, it’s not like half the voters who voted in the two state races then bailed on the Senate contest.
UPDATE2: My colleague John Sides of George Washington has an eerily-similar post about the SC race at his site, The Monkey Cage. (Neither of us knew what the other was up to, just FYI.)
#N.B.: White/non-white registrant shares provide an imperfect indicator of racialized voting in the Democratic primary. For one, there are some non-whites who aren’t African American in South Carolina, including a small percent of Hispanics and some Native Americans mostly in the western part of the state; still, African Americans account for the vast majority (28.5%) of South Carolina’s non-white (34.8%) statewide population, according to 2009 Census figures. Moreover, even if we knew a county’s registrants were 50 percent black and 50 percent non-Hispanic white, the white half could be all Democratic or all Republican in their partisan orientations. South Carolina does not record registration by party, and both gubernatorial primaries were “open” in the sense than any eligible registered voter could vote in either primary–which, of course, opens up the possibility of partisan tinkering by Republicans who wanted to strategically (and perfectly legally) pick Jim DeMint’s opponent.