Last week two very important and wide-ranging economic reports were released: the Beige Book and the second quarter GDP report. The Beige Book provides good background information on the economy, but due to the length of the GDP report that follows, the Beige Book is beyond the scope of this article. I have three summations of the information contained therein on my blog that you can read here, here and here. The short version of the report is the expansion slowed over the last six weeks.
Below is a detailed look at the second quarter GDP report. The original report is here.
First, let’s see how this recovery’s first four quarters stack up against the previous two recoveries’ first four quarters in terms of GDP growth.
Here is a chart comparing them:
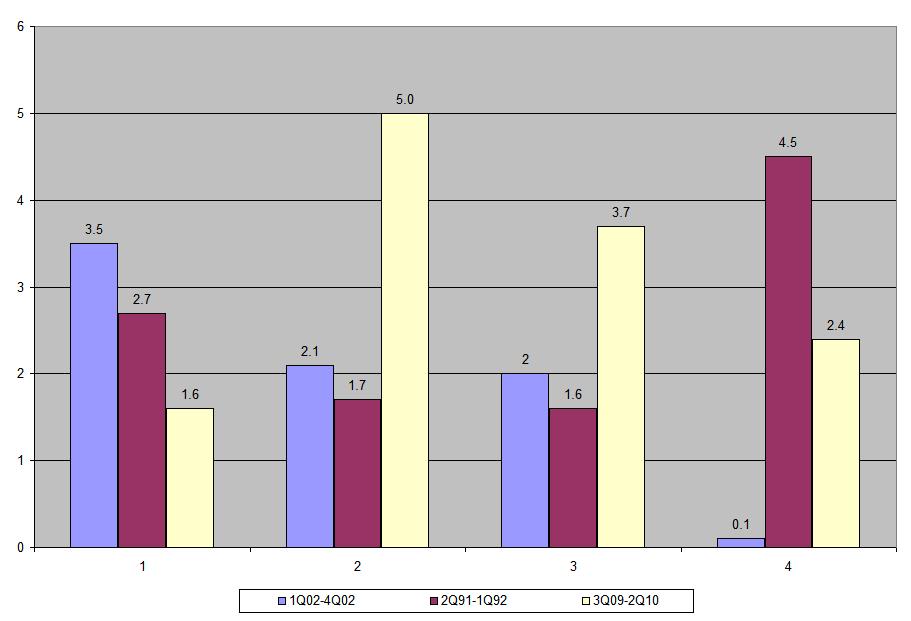
The purple lines represent the first four quarters after the 1991 recession. Notice how they started out slowly for the first three quarters but jumped higher in the fourth quarter after the recession. In comparison, notice the blue lines that represent the post 2001 quarter to quarter GDP growth which continually declined for three quarters after the recession ended. This recovery has printed strong numbers for the second and third quarters coming out of the recession and still printed a 2.4% in the fourth. By way of comparing the last three recession, here is a chart of the median rate of growth of the last three recoveries in the four quarters after the recession ended.
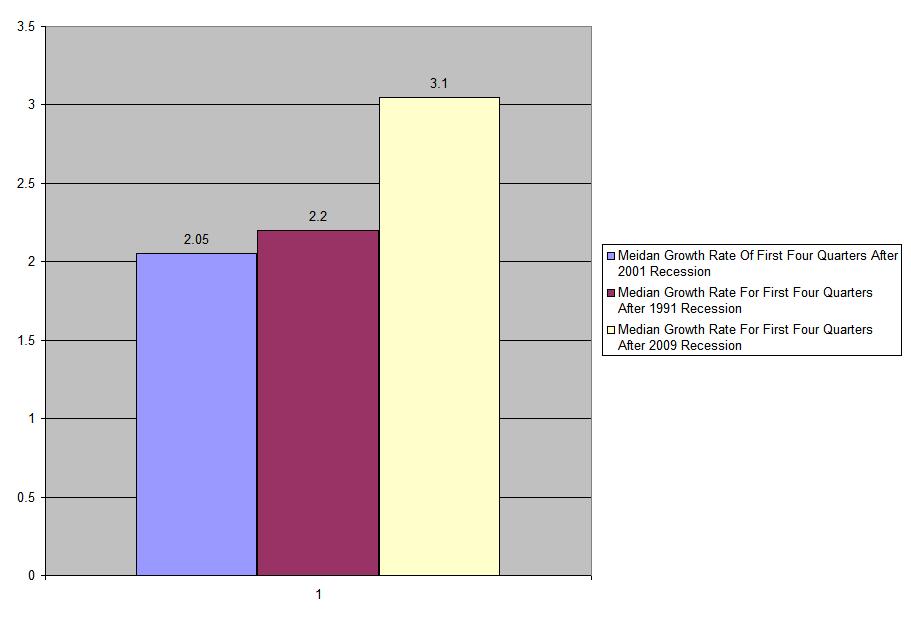
Note this recovery is printing a far stronger median growth rate than the other two recoveries four quarters in.
Here is a chart that shows what parts of GDP contributed to growth:
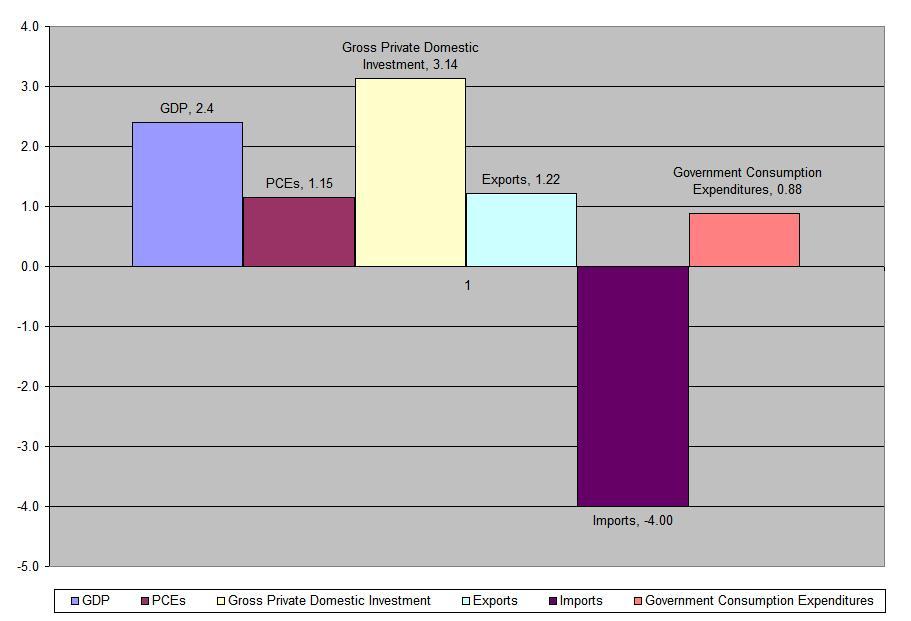
Notice the growth is spread out across different categories — PCEs, investment and exports all contributed.
Below are four charts that show real personal consumption expenditures and the various components of PCEs for the last four quarter.
 Real PCEs are increasing at a moderate pace.
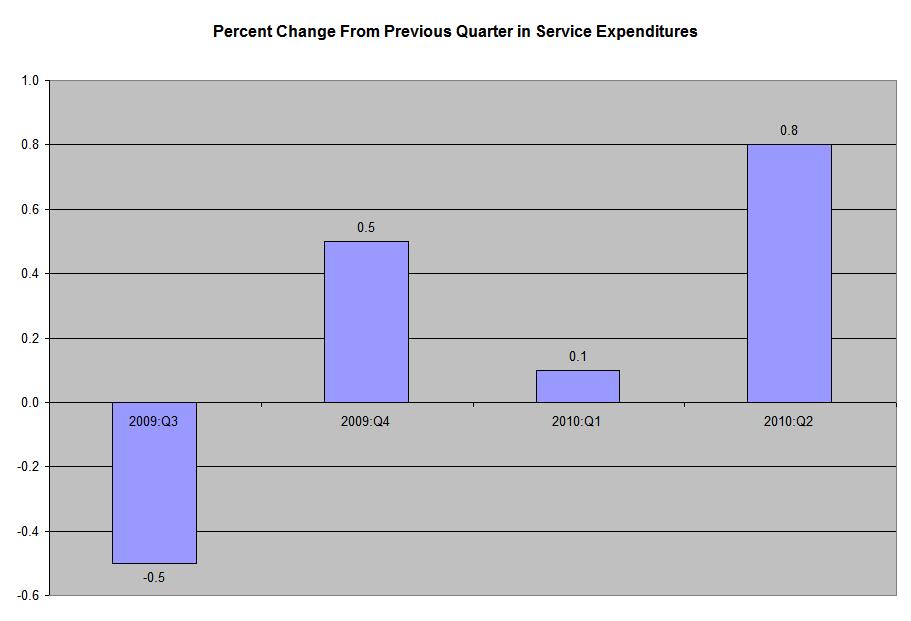
Services comprise the largest percentage of PCEs, representing about 65% of all expenditures. Last quarter was the first quarter these picked-up over the last four quarters.
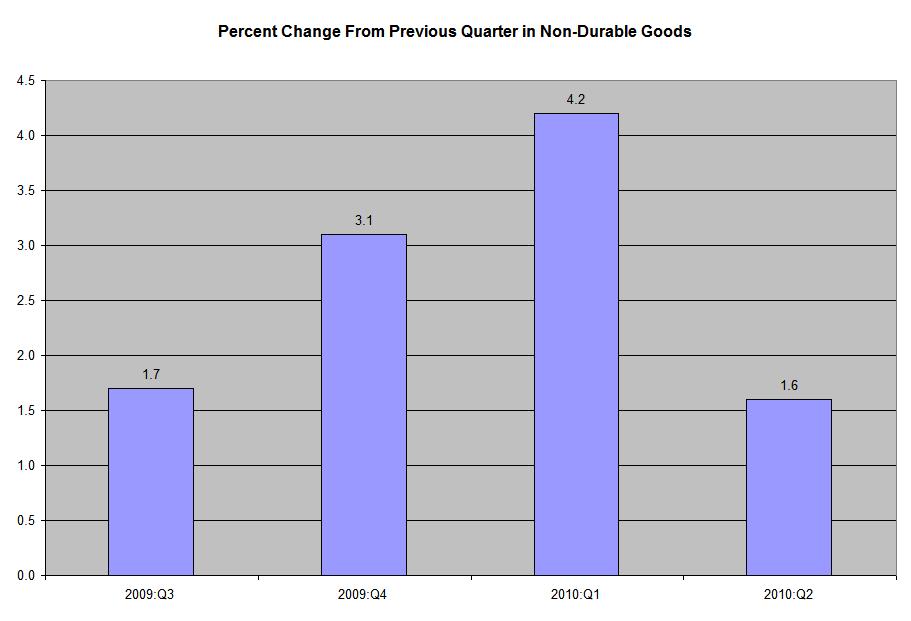
Non-durable purchases were increasing nicely, but dropped a bit last quarter.
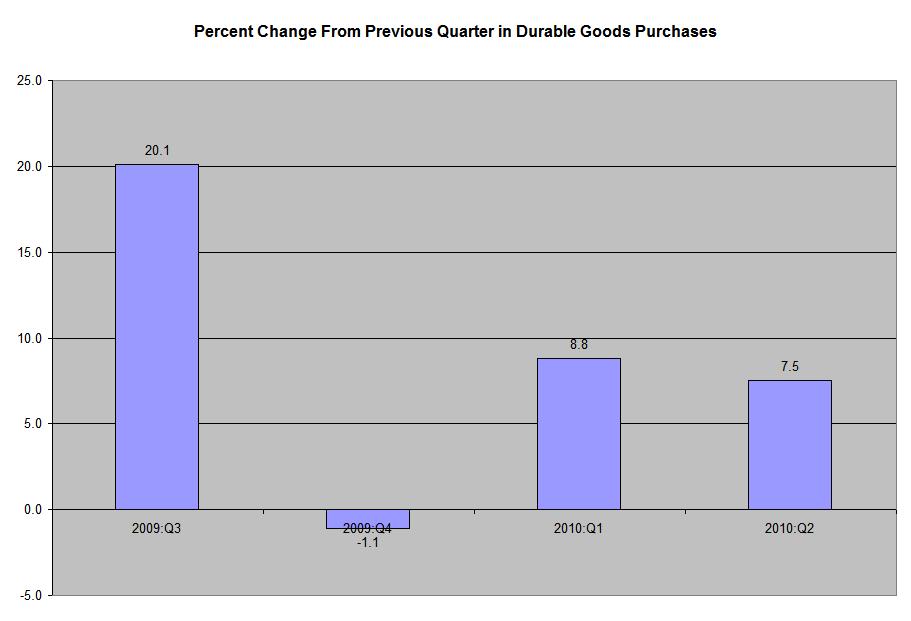
Sales of durable goods have increased at a solid pace for the last two quarters and three of the last four quarters.
Now let’s look at gross domestic investment.
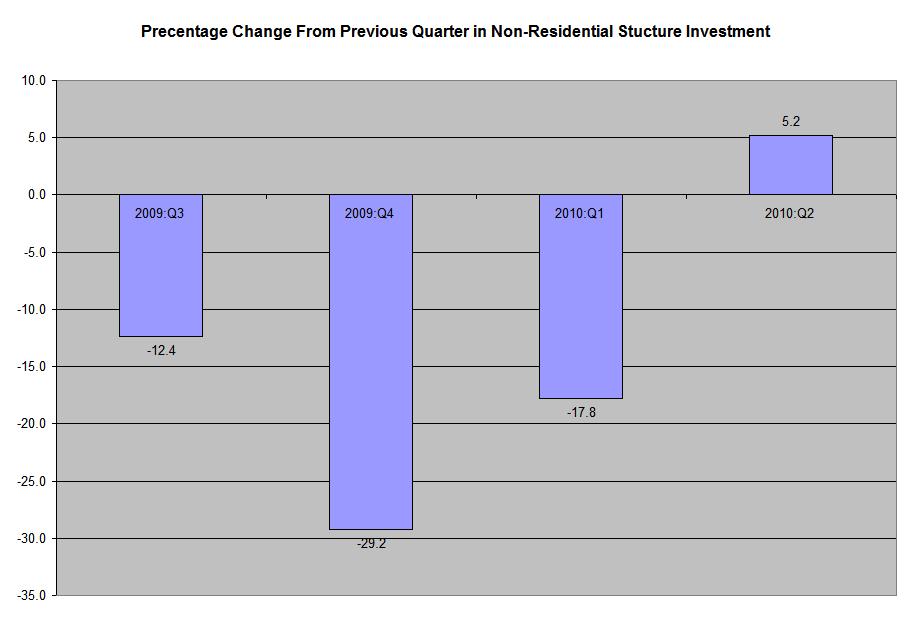
Non-residential structures investment increased last quarter for the first time in four quarters.
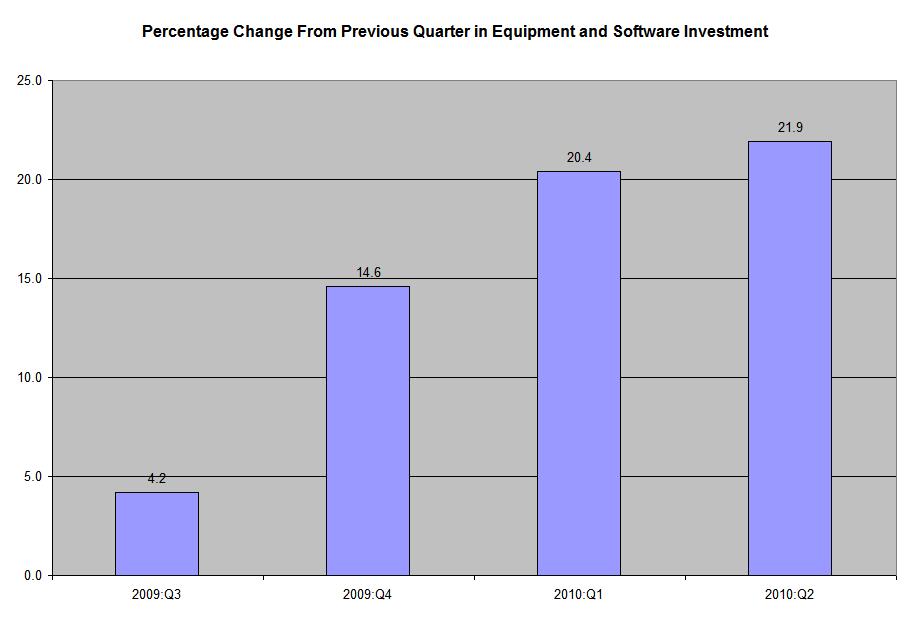 Investment in equipment and software continues to increase at a strong pace.
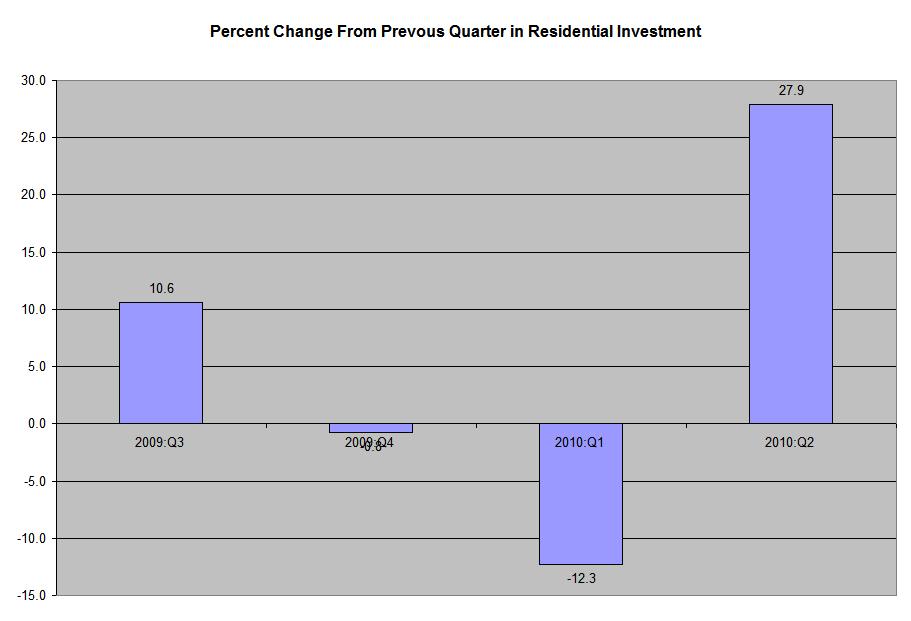
Residential investment increased last month as well.
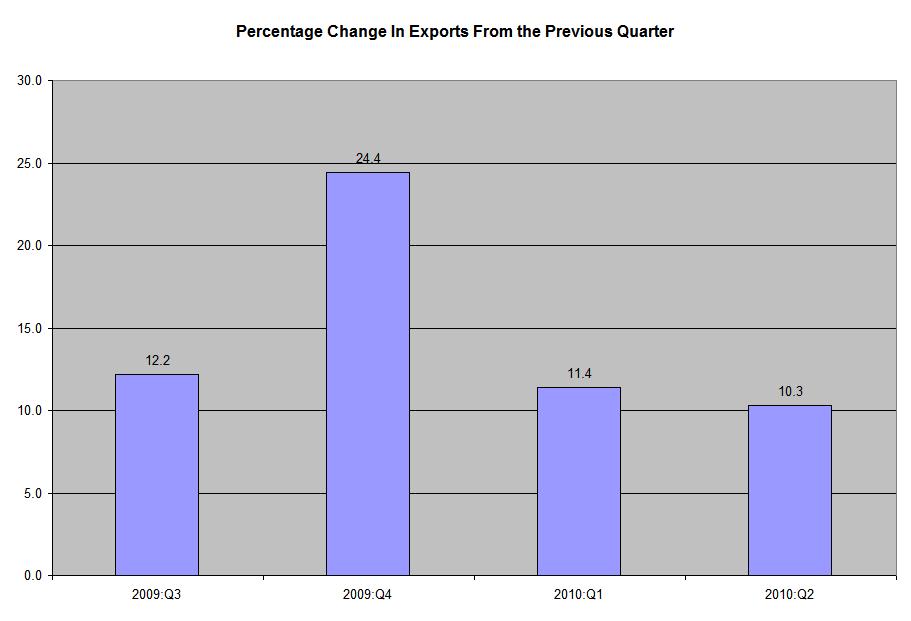 Exports have been increasing at a good rate for the last four quarters.
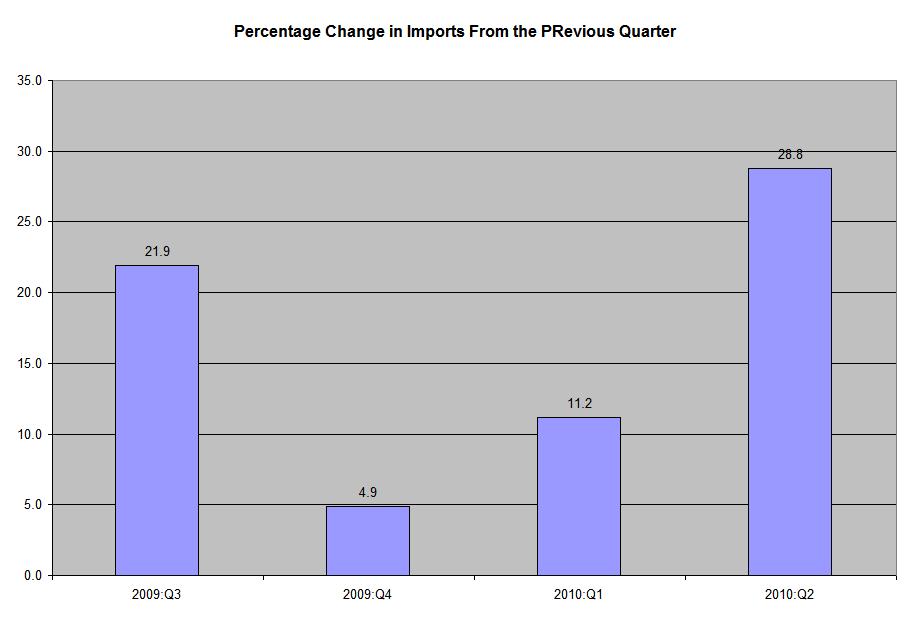
Last quarter saw a big surge in imports, which detract from GDP.
Let’s tie all this together:
1.) While the pace of GDP growth has decreased for the last two quarters, it is still growing at a decent but not good rate. In addition, GDP is growing at a faster median rate for the first four quarters after the recovery than the previous two recession.
2.) PCEs are increasing modestly. Despite low consumer confidence and sentiment, durable goods purchases are surprisingly strong. The interesting laggard is service expenditures which were growing at approximately twice the current rate before the recession.
3.) Businesses continue to invest in equipment and software, retooling their facilities and facilities. In addition, the increases in residential and non-residential investment were welcome surprises.
4.) Exports continue to increase at a good pace, indicating the rest of the world continues to grow.
5.) The real surprise in the report was the increase in imports, which grew 35.4% from the previous quarter.