I recently subscribed to PollingReport.com, and had some time today to backfit a whole bunch of polling data from previous election cycles into my pollster report card. I now have a database of over 150 competitive contests since 2000. This includes essentially every competitive presidential race, and most competitive primary races, Senate races, and Governor races. I also expanded the playing field literally to include a number of new pollsters, including both some national pollsters and some regional ones, up to a total of 32 pollsters in all. A pollster was included if it had at least 5 surveys in my database.
My methodology remains essentially the same as in this Daily Kos diary. My process is to look at the average miss for each pollster across each contest they polled, and compare it to the average miss of other pollsters in those same contest, after going through a more-complicated-than-it-needs-to-be iterative process.
The results are below, split into groups for ‘regional’ and ‘national’ pollsters. (This distinction is arbitrary — some pollsters like Insider Advantage and Quinnipiac straddle the line between being regional and national — but helpful for presentation). ‘Error’ represents the average error for the particular pollster, as compared to the ‘IAE’, which is the iterated average error for other pollsters in those same contests.
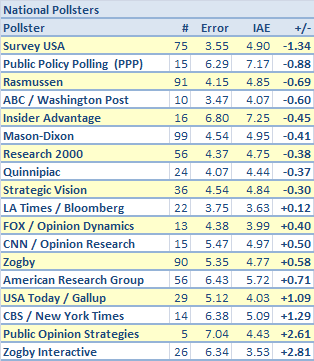
The way to read these numbers is that Survey USA, for example, has been an average of 1.34 more accurate than an average pollster; this is an outstanding number, and remains something of an outlier. We’ve also included a couple of new major media pollsters: ABC/Washington Post, which is fairly decent, and CBS/NYT, which is pretty awful. Oh, and the Zogby Interactive polls, which are off-the-charts bad — considerably worse than Zogby’s telephone polls, which are themselves quite poor. Insider Advantage has moved up a little bit; I don’t like certain elements of their methodology, but their results have been fairly decent, and they’re smart enough to stick to polling in the South, which is a region that they know well. Gallup continues to subsist on name recognition only. Their national polls may be fine, but they aren’t doing anyone any favors when they deign to poll state-by-state matchups.
Now, for the regional pollsters:

The sample sizes here are obviously much smaller. But Sezler and the California Field Poll live up to their stellar reputations. The Ohio Poll (University of Cincinnati) and the University of New Hampshire polls have also done quite well, as have the Chicago Tribune polls, through the Market Shares polling firm. On the other end of the spectrum is the Columbus Dispatch, which conducts its surveys by mail, and pays the price in terms of its results. There are arguments for excluding Columbus Dispatch and Zogby Interactive polls entirely from the analysis.
The last step is to translate these numbers into weights, which involves some algebraic transformations that translate the pollster’s average margin of error into an effective sample size, while also regressing to the mean for pollsters with a small number of surveys. These weights are calibrated such that the average poll (not necessarily the average pollster, since the better pollsters tend to be more prolific and poll more contests) will have a weight of 1.00.

Survey USA rates way ahead here, because it has not only gotten good results, but done so over a large number of contests. A Survey USA poll will be weighted around 3x as much as a Zogby or an ARG poll in our weighted polling averages.
NOTE: The recalibrated pollster ratings are not yet incorporated in our simulations and weighted averages, but they will be once we get a couple of new polls in and do a fresh run of the data.