As I wrote a couple of weeks ago, the Republicans need something like a 7% swing in the national vote to take back the House of Representatives in 2010.
From Erikson, Bafumi, and Wlezien, here is a graph predicting the Democratic party’s vote share in midterm elections, given their support in a generic party ballot from polls taken during the 300 days before the election:
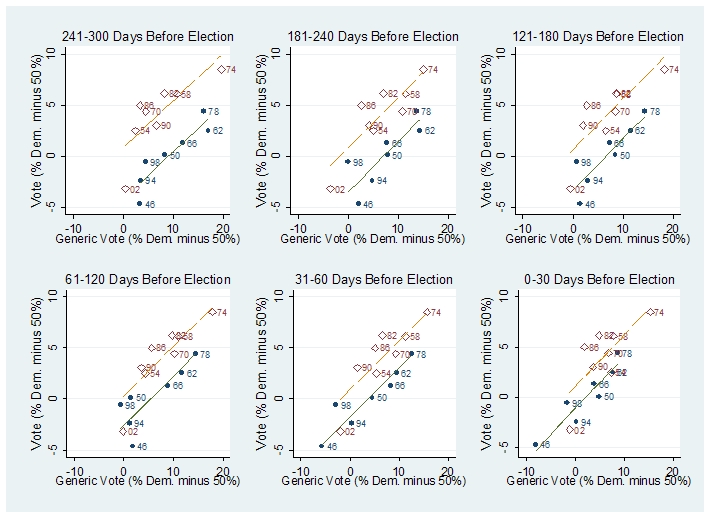
The higher line in each graph (in red) corresponds to elections where the incumbent president is a Republican, and the lower line (in blue) corresponds to elections such as 2010, where the incumbent is a Democrat. The difference between the two lines reflects the traditional bounce away from the president’s party.
As John Kastellec, Jamie Chandler, and I have discussed, the mapping from votes to seats is not perfect–for 2010, I’d guess that the Republicans need an average district vote of about 51% to win a House majority. Also, we’re still half a year from the very first time point of the above plot (241-300 Days Before Election). But these graphs are something to keep in mind a few months from now, when the generic House polls start to appear.