Oh, what the heck: Let’s piggyback on my post yesterday with a post addressing another canard from Jonah Goldberg’s platitude-filled column Tuesday in USA Today. After hailing the tea partiers’ understanding of how taxes are inimical to liberty, he writes:
Individual liberty is far from the only concern, either. The kind of country we want to be is deeply bound up in taxation. The Tax Foundation estimates that some 60% of American families already get more from the government than they pay in taxes (and the top 10% of earners pay more than 70% of the income taxes). If all of President Obama’s plans are enacted, that percentage will increase. We are heading toward being a country where instead of the people deciding how much money the government should have, the government decides how much money the people should have.
Only after they passed “ObamaCare” did Democrats clarify that this was one of their motives. ObamaCare’s appeal has less to do with saving money — which it won’t do — and more to do with spreading the wealth around. Senate Finance Committee Chairman Max Baucus, D-Mont., recently admitted that alleviating the “maldistribution of income in America” from the haves to the have-nots is one of the legislation’s real benefits.
Ah, so the real problem with the American tax code is that it does such a great job (which is to say dastardly job, in Goldberg’s view) of redistributing income and wealth–of robbing Peter to pay Paul. Again, this is an empirical issue, not merely a conveniently assertable talking point, which means we can examine just how redistributive America is relative to comparable nations.
 Back we go to the OECD data. The above figure reports, for all OECD nations during the mid-2000s*, the Gini Coefficient before taxes and transfers. For those unfamiliar with the Gini Coefficient, it is a measure of the distribution of income (or wealth), bounded between 0 and 1, with zero meaning equal distribution across all citizens and 1 meaning that all the income/wealth belongs to the one, richest person. That is, the lower the number the more evenly–though not necessarily fairly, which is a normative judgment for each person to make for herself–income is distributed prior to (or after) government activity in the form of taxes and/or transfers.
As you can see, the before-taxes-and-transfers Gini Coefficient for the United States (.46) is very close to the average for all nations of the OECD (.45). Put another way, the ex ante maldistribution of income here is about the same as for comparable nations. To see what the net effect of those government policies are, we need to look next at the after-tax-and-transfer Gini Coefficients.
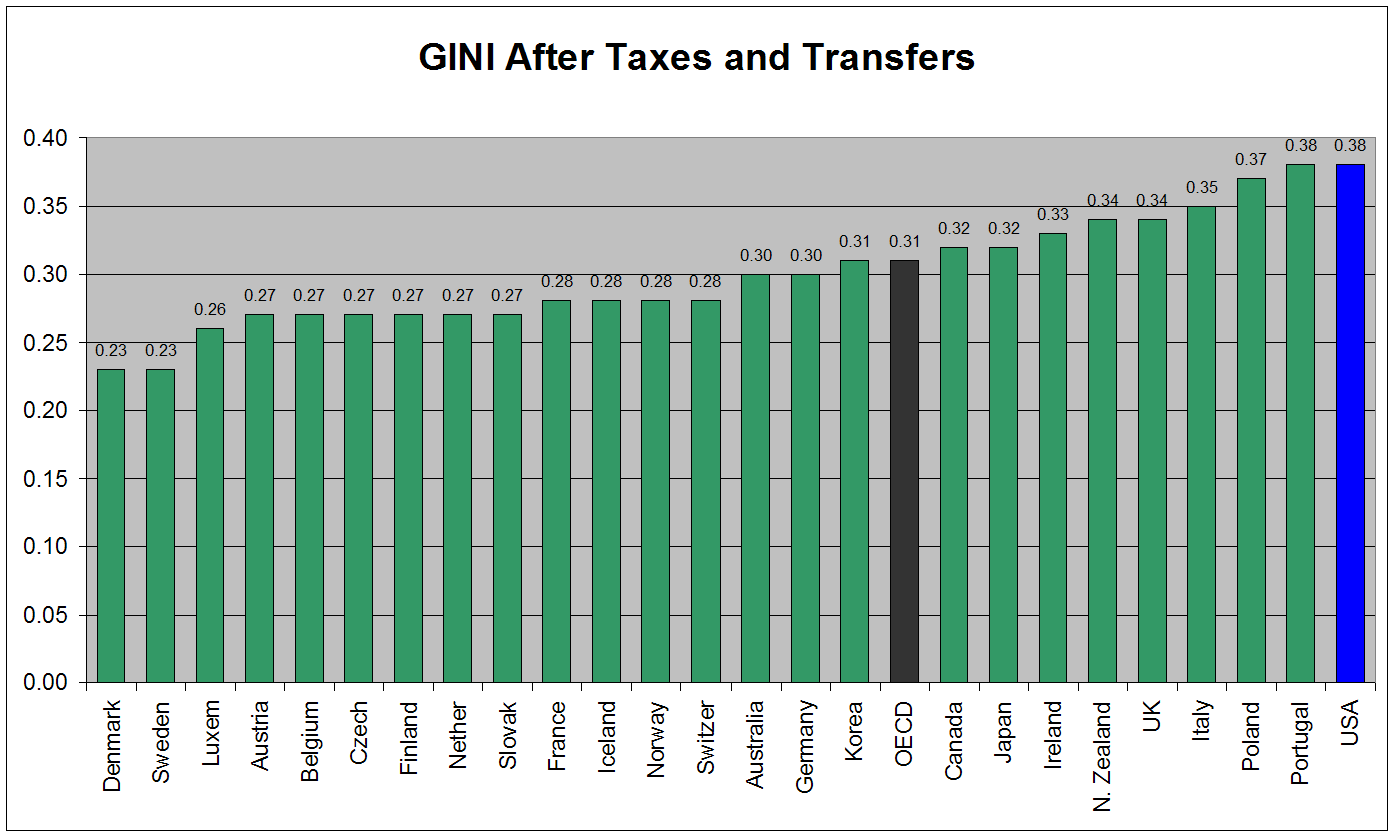
And what do you know? As shown in the second figure, which reports after-tax-and-transfer income distribution, of the 26 OECD countries the United States has the most maldistributed income of all 26. This doesn’t mean that tax and transfer policies don’t redistribute; they do, which is why the after-t+t coefficient of .38 is lower than the pre-t+t coefficient of .46.
But that’s not particularly redistributive. In effect, Jonah Goldberg is complaining about the dangers of redistribution in the least redistributive first world nation. Tax-wise, he would be doing much worse as a columnist/author/speaker in almost any other country. But why let that stop him from complaining?
Allow me let me summarize my frustrations with how conservatives like Goldberg (not all of conservatives, of course) talk about taxes, redistribution, the size of government, it’s effectiveness and efficiency:
1. Dollar for dollar, America offers the most effective and efficient government on the planet, doing so for about 20 cents on the dollar nationally, 28 cents if you include state and local taxes. If you ask a conservative to name a country that provides as many quality services for less, or more and better services for the same price, they can’t name one. If they do, encourage them to start packing their bags. Sure, they could save a lot of money living in Mexico–if they don’t count all the bribes they’ll have to pay to educate their kids and protect themselves from possible violence. Bottom line is we’re simply not as big as conservatives would have us believe. This doesn’t mean we shouldn’t seek efficiencies, govern more effectively within budget constraints, or try to eliminate fraud and abuse. But American government is pretty clean and fairly lean.
2. American government is redistributive, but not to the degree to which boogeyman conservatives would have us believe. Again, look at the two charts above. We’re clean and lean, but if you believe in sharing the wealth, comparatively we’re also pretty mean.
3. When it comes to deficits and fiscal responsibility, conservatives tend to focus on the spending and not the taxation side. If you’re raising less than you’re spending, you can either raise more, spend less, or some combination of both. But conservatives invariably turn the conversation to how big government is as a spender, rather than how small it is as a taxer. And frankly, too many Americans of all ideological stripes simply want a free lunch. We know this because when you give them access to policies at the ballot, they vote for guaranteed spending and restrictions on taxes. (See California, the state with the single WORST debt burden in the country.)
4. It’s just a myth that all this American “socialism” will only constrain our growth, turning us into one of those laggard western European nanny states. There is way too much to cover here, so I’ll just point to Jon Chait’s recent takedown in the New Republic of conservative Jim Manzi’s supposed case-closed case for why America’s smaller government produces higher growth rates.
In sum, Jonah Goldberg’s boogeyman piece implies that America is too big of a government (wrong), that we redistribute significant income and wealth (wrong again), and that this redistributive pattern only fosters economic stagnation, as demonstrated by the performance of economies in “socialist” Europe (wrong yet again).
Boo! Happy Tax Freedom Day, gang.
*N.B.: I should explain why there are only 26, not 31 countries, in the figures above. If you toggle the tag at the top of the OECD data link, you’ll notice that the OECD provides after-taxes-and-transfers Gini coefficients for all 31 countries but before-taxes-and-transfers data for only 26, with missing data for Greece, Hungary, Mexico, Spain and Turkey. I’m not sure why this is, but wrote this note to clarify for those who may be wondering about the missing five.