On Friday, the BEA released the first estimate of 1Q GDP, which printed at 3.2%. Below is a detailed analysis of the number along with an explanation.
Let’s begin with an overview of the series. Here is a 10-year chart of real (inflation-adjusted) GDP:
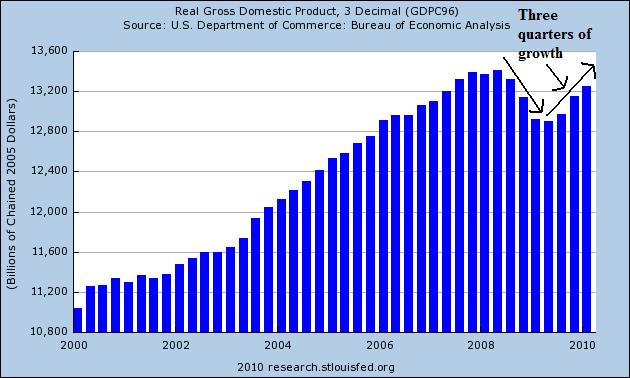
This graph shows the US has now had three quarters of GDP growth. In other words, the recession is over.
GDP is composed of PCEs — personal consumption expenditures, investment (residential and non-residential), a net of imports and exports and government spending. Let’s take each of these areas in turn.
Personal Consumption Expenditures:
Real personal consumption expenditures increased 3.6 percent in the first quarter, compared with an increase of 1.6 percent in the fourth. Durable goods increased 11.3 percent, compared with an increase of 0.4 percent. Nondurable goods increased 3.9 percent, compared with an increase of 4.0 percent. Services increased 2.4 percent, compared with an increase of 1.0 percent.
These are strong numbers and indicate the consumer is “back.” More importantly, these numbers include more data than retail sales, which only includes information from retail level stores. PCEs include all consumer purchases. Here is a chart of overall PCEs (which does not include Friday’s data):
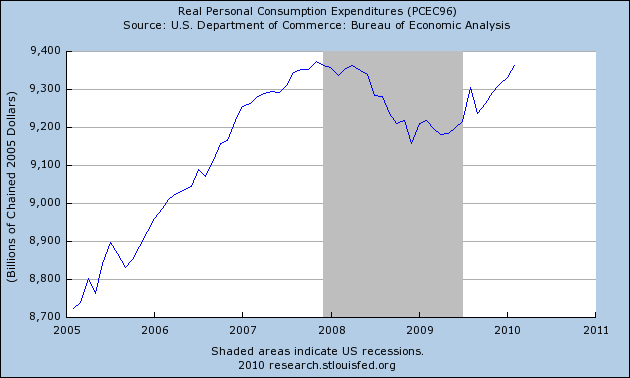
PCEs bottomed in in early 2009 and have been increasing since. With Friday’s data, this chart will increase again. PCEs are comprised of three different data sets, which are (from the largest to the smallest) service expenditures, non-durable goods expenditures and durable goods expenditures. All three of these sub-sets increased in the latest data, indicating consumers are purchasing a variety of goods rather than one type of good. Again, this is a very healthy development and indicates the economy is not being unduly influenced by a single policy such as cash for clunkers. Overall, the above information indicates consumer spending is increasing at a healthy clip.
Let’s move onto investment, first looking at residential investment.

This number has dropped precipitously over the course of the recession. The primary reason is the US built far too many houses and is now (still) dealing with excess inventory based on current demand levels. As a result there is little reason to meaningfully increase residential investment and won’t be for the foreseeable future.

Above is a chart of the YOY percentage change in real residential investment. While it does show an increase, remember the preceding chart when looking at this data. The YOY data series is coming from a very low level and still has tremendous inventory overhang. The YOY “increase” is really more a function of coming from a low level rather than strong growth.
On the non-residential (commercial) side, we had some bad and good news.
Nonresidential structures decreased 14.0 percent, compared with a decrease of 18.0 percent. Equipment and software increased 13.4 percent, compared with an increase of 19.0 percent. Real residential fixed investment decreased 10.9 percent, in contrast to an increase of 3.8 percent.
Commercial real estate investment dropped again. This is to be expected given the CRE market is going through the same issues as the residential market — an overbuilt condition. But the 13.4% increase in equipment and software is a very healthy development and indicates businesses are comfortable enough with future prospects to invest in equipment.
Real exports of goods and services increased 5.8 percent in the first quarter, compared with an increase of 22.8 percent in the fourth. Real imports of goods and services increased 8.9 percent, compared with an increase of 15.8 percent.
There are good and bad sides of these numbers. The good news is that exports are increasing, indicating US manufacturing is producing goods for foreign markets. In addition, imports are increasing, indicating consumers are increasing purchases. The bad news for these figures is imports are increasing faster than exports, indicating the trade deficit is again widening.
Real federal government consumption expenditures and gross investment increased 1.4 percent in the first quarter, compared with no change in the fourth. National defense increased 1.2 percent, in contrast to a decrease of 3.6 percent. Nondefense increased 1.7 percent, compared with an increase of 8.3 percent. Real state and local government consumption expenditures and gross investment decreased 3.8 percent, compared with a decrease of 2.2 percent.
What is interesting about these numbers is the effect of state level budget issues on overall economic growth. Federal expenditures are adding to growth. But the budget issues at the state and local levels are subtracting from growth, indicating the severity of the problem.
The change in real private inventories added 1.57 percentage points to the first-quarter change in real GDP after adding 3.79 percentage points to the fourth-quarter change. Private businesses increased inventories $31.1 billion in the first quarter, following decreases of $19.7 billion in the fourth quarter and $139.2 billion in the third.
Expect harping on this point, with arguments like “it’s not real growth” or “it can’t continue”. Considering the massive drop in inventories that we’ve seen over the recession the trend can continue for some time, so that argument is moot. In addition, inventory restocking is just as important an economic activity as, well, all other economic activities.
Most importantly, the economy is now at a point where historically it should start creating jobs. Consider the following two charts from the FRED data system:
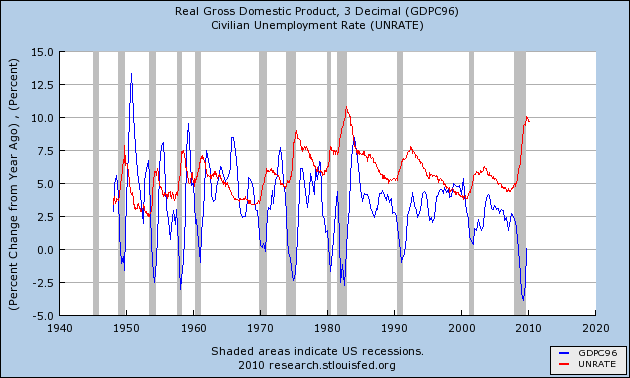
The top chart shows the year over year percentage change in GDP and the unemployment rate. First notice the unemployment rate is a lagging economic indicator — it improves (drops) after the economy starts growing. The reason is simple: businesses need to have “visibility” — the ability to reasonably project profits before they start hiring. Three quarters of growth should help in that process and put the economy is a job growth position going forward.
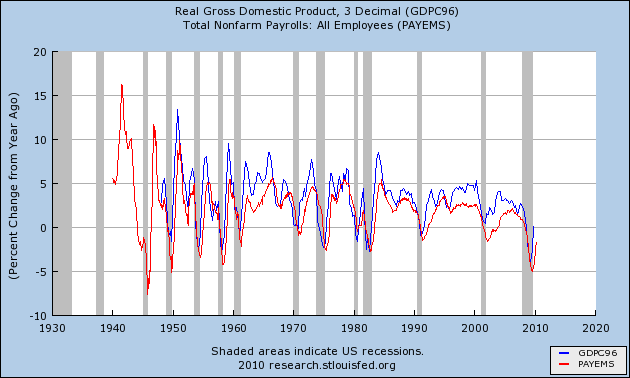
The second chart shows the year over year percentage change in GDP and the total number of establishment jobs which is a “coincident” indicator — meaning it rises and falls (more or less) with the overall GDP number (although the chart indicates it is really a “slightly lagging” indicator”). Again note that when the year over year percentage change in GDP starts to increase job growth begins as well, explaining the recent increase in hiring (last month total establishment jobs increased 162,0000). With this GDP report, it is reasonable to expect more job growth in the coming quarters. Assuming we see good job growth going forward (meaning a monthly increase of at least ~150,000) we should see a continued increase in PCEs.
This is the third quarter of GDP growth. It demonstrates that growth is coming from a variety of economic sectors. The consumer is spending again, businesses are investing, and exports are increasing. The conclusion is clear: the economy is no longer in recession.